By popular request we've made a number of major enhancements to the Activity page. Gone is the simple table of searches per day and in it's place we've included charts which break down the number of location searches conducted in your locator by different timescales.
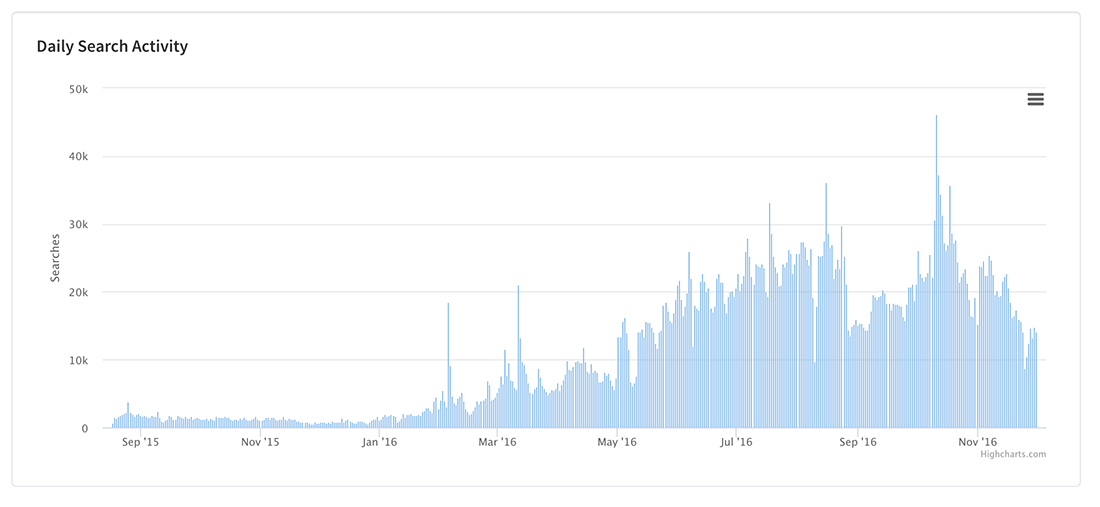
Firstly, the top chart shows the number of searches conducted dating back to August 2015 which was when we first started tracking the searches conducted by users of our locator:

You can change the date range using the date range selector at the top to drill down into your data in more detail.
![]()
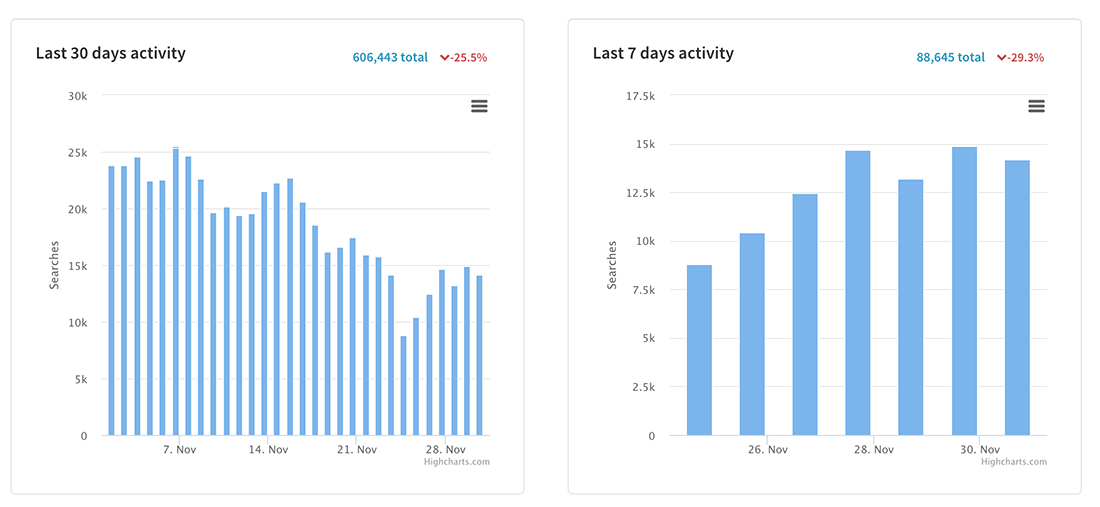
The second row is two charts showing search activity for the last 30 day and 7 day periods. We include for comparison the difference from the latest 30 day period to the previous 30 day period and the same for the 7 day chart:

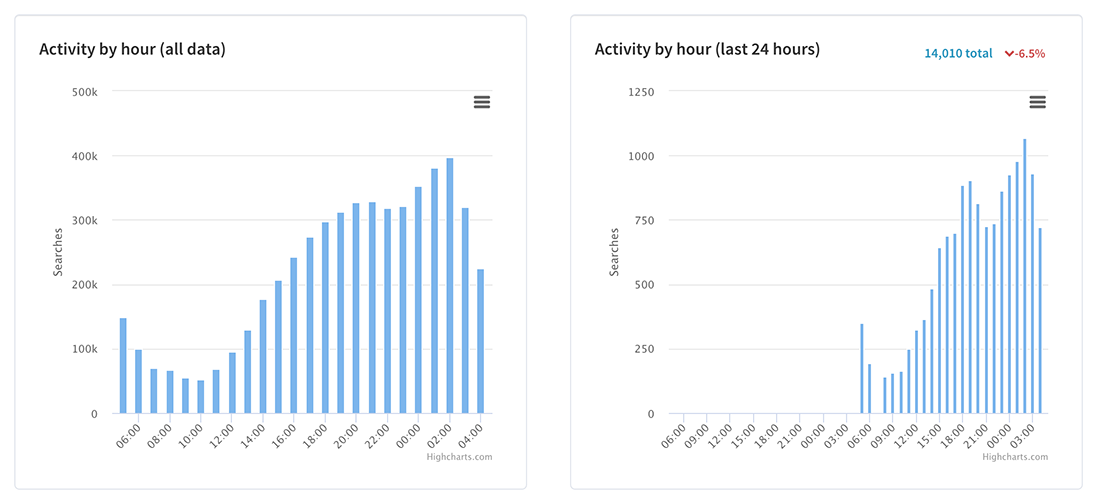
The final row shows the search activity by hour. The first chart is the activity by hour across all your data and the second chart is the activity by hour for the previous 24 hour period. Please note that due to the volume of search data that we collect, we only update the hourly data once every day at 2am so this information is not real time:

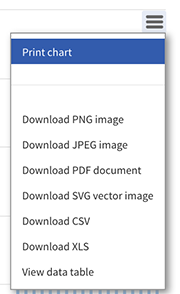
If you'd like any other chart data let us know, we're happy to add more if you need it! Oh, one more thing - if you want to export the charts to an image or to see the raw table data, just click on the icon with three horizontal lines (called a hamburger icon for some unknowable reason) and you'll see a choice of export formats:

That's all folks!